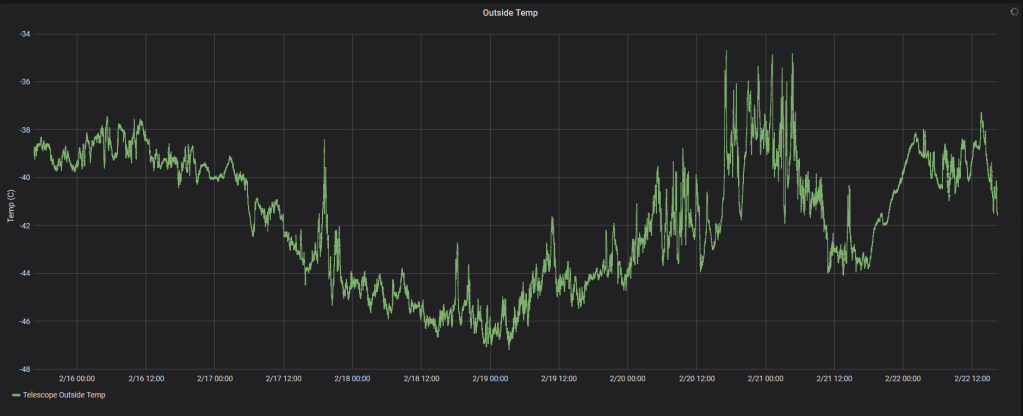
Weather: Warmer , about -40 with windchill near -70. Slightly overcast.
For funsies, here’s a plot of temperature over the past 7 days:
Today I spent all day helping move the beverages into one of the empty berthing wings. We now have 9 rooms FULL of beer, wine, liquor and sodas to get us through the winter (and also to get the folks through next summer)… Hopefully I get a free beer or something for helping out 😉 .
Tonight is “Adventure Movie Night” – a night full of adventure, and movies… well one movie, about adventure, I guess… This is a weekly event put on by the station manager, Wayne White. He’s a really interesting guy who likes historical explorers and is an explorer himself. He’s managed remote stations all around the world and now is the first person EVER to be the Winter South Pole Station manager 3 times (and this year is 2 in a row, which is also unusual). Anyway, tonight’s movie is about Scott’s ill-fated Tera Nova expedition, and I think, historic Antarctic exploring in general.
I go back on-call tomorrow for the next week, but things have been going so smoothly that there haven’t been any pages all week. There have hardly even been any failed autoprocessing of data, or scanification of raw timestreams! … things seem quiet, too quiet. We also observed a new calibrator source for our low-elevation summer fields. I quickly made a map of it to check that it looks like a reasonable source and has good signal-to-noise ratio, etc.
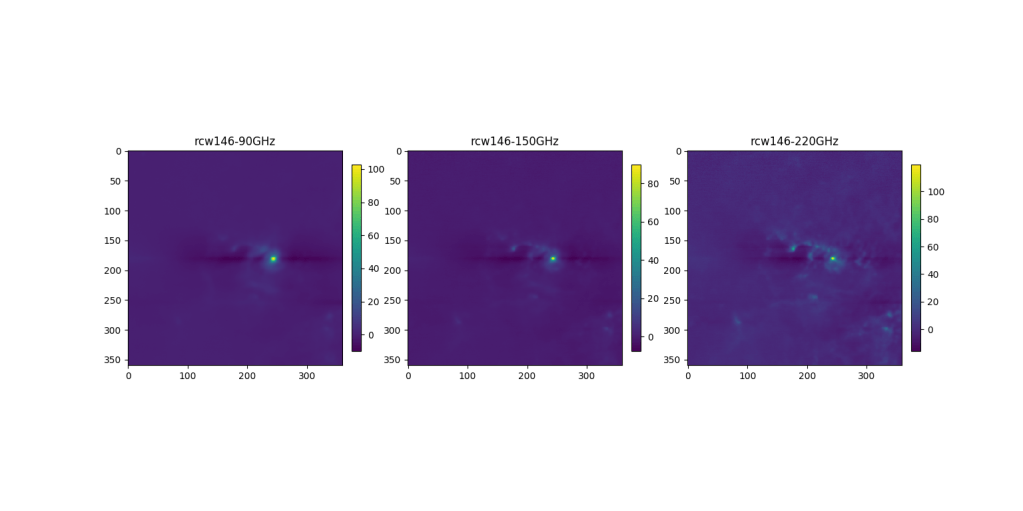
These calibrator sources are large H-II (hydrogen) regions that have a steady signal over time. We use them to correct for the changing opacity of the sky (basically how much water vapor is in the atmosphere).
Another mini side-project I’m playing around with right now is looking at archival data for transient sources — things that appear and then disappear in the maps. It’s a very basic analysis that I’m using, but basically I just look at small chunks of our full field map (from a coadd of say, one month), find point sources, and then ask if those point sources exist in all other month’s maps. Really I want to understand how often this happens for different time frames (i.e. daily maps, weekly coadded maps, monthly coadded maps, etc) because we’re about to put an online transient analysis to work which searches for these sources in real-time. Here’s an example of a source which passed my monthly transient search:
That’s what I’ve been up to — I’ll try to post more non-work activities later, but most of that is just me in the gym… so it’s not too exciting.
Cheers!

Hey Allen – curious what you hope to learn from the side project on transient sources. For example, once you have the online transient analysis database available, how will that help or be used by you/others? Thanks! George
LikeLike
Good question… I guess I could learn a few things; most likely I will get a sense of how my filtering creates false-positives and how often I can expect a) flaring sources to trigger something and b) real transients to appear in maps.
Ideally, once all of the backgrounds/false positives are sorted out, one could get an idea of the expected rate of transient sources over our observation region, as well as the timescale on which they appear/dissapear — that could tell you something about the source of the signal that you’re seeing.
The online transient analysis is not one I’m actually implementing myself, but I think the idea is that we will know when/where a source pops up in our maps, and could send out an astronomical alert to people who are interested in this sort of thing. They could then do follow-up observations and track the evolution of the source.
LikeLike
Got it. Very cool. Thanks!
LikeLike
I need a glossary. “Sastrugi”??? (You don’t have to answer this.) For all I didn’t understand, I see you’re exploring questions, doing research and keeping mentally engaged: I’ll take that! ps. love the posts
LikeLike